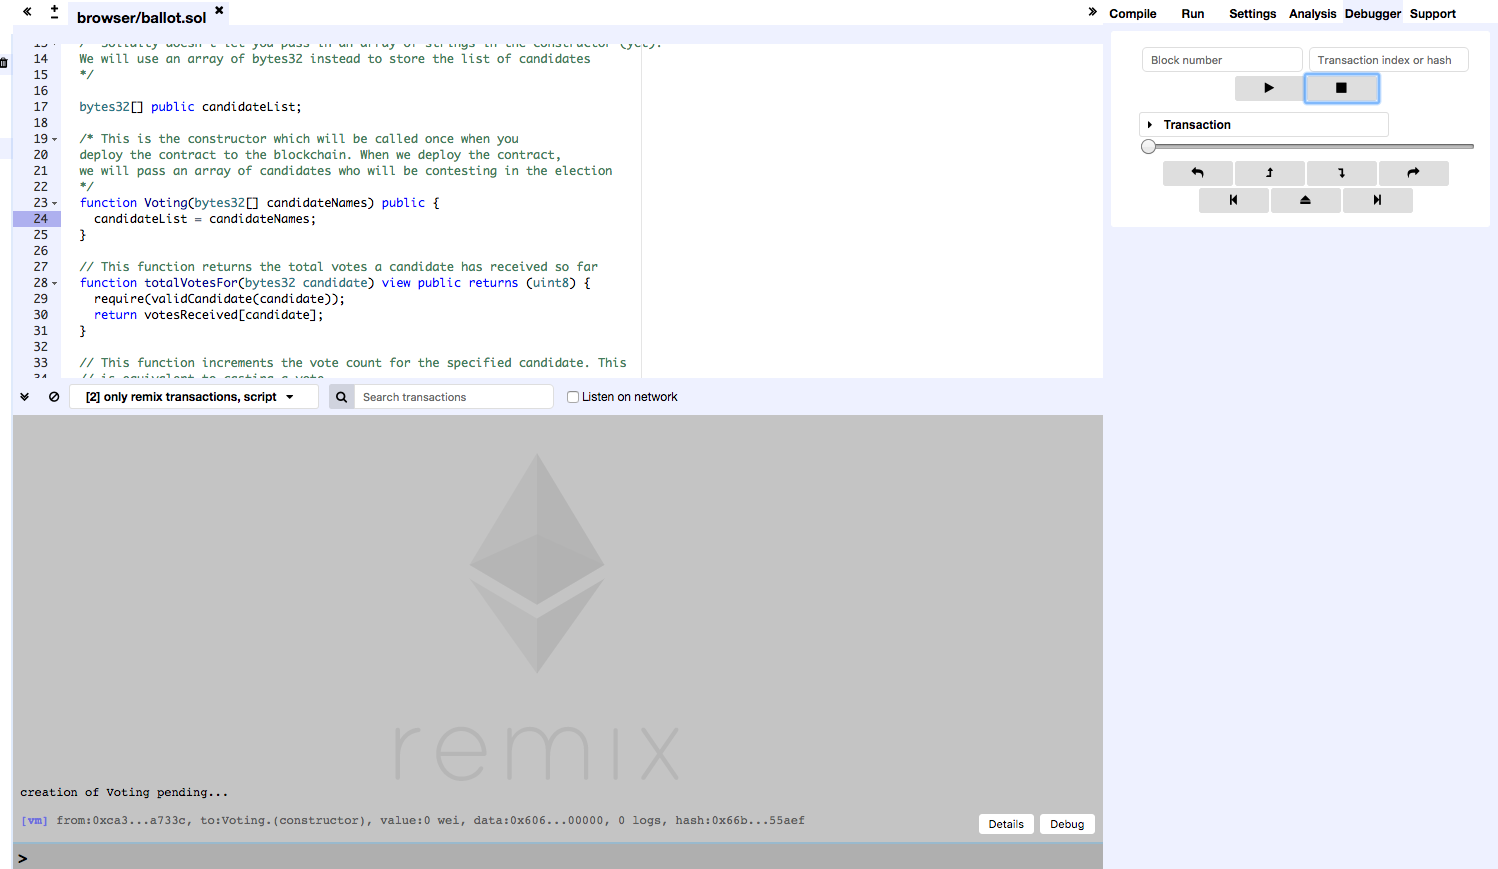
You can add breakpoints in your code to use when debugging your smart contract. You can do this by clicking on the line number of where you want to set your breakpoint.
In this example, I set my breakpoint at line 24 when the constructor is called.

There are several ways to debug your contract. You can click on the Debugger tab and insert a block number or transaction hash and press the play button to go through the steps. But what I like to do is to run a method I want to test and then press the Debug button in the console. That will load up the correct transaction hash.
In this example, I put a breakpoint when the constructor is called, initialized my contract in the Run tab, and then pressed the Debug button in the console.

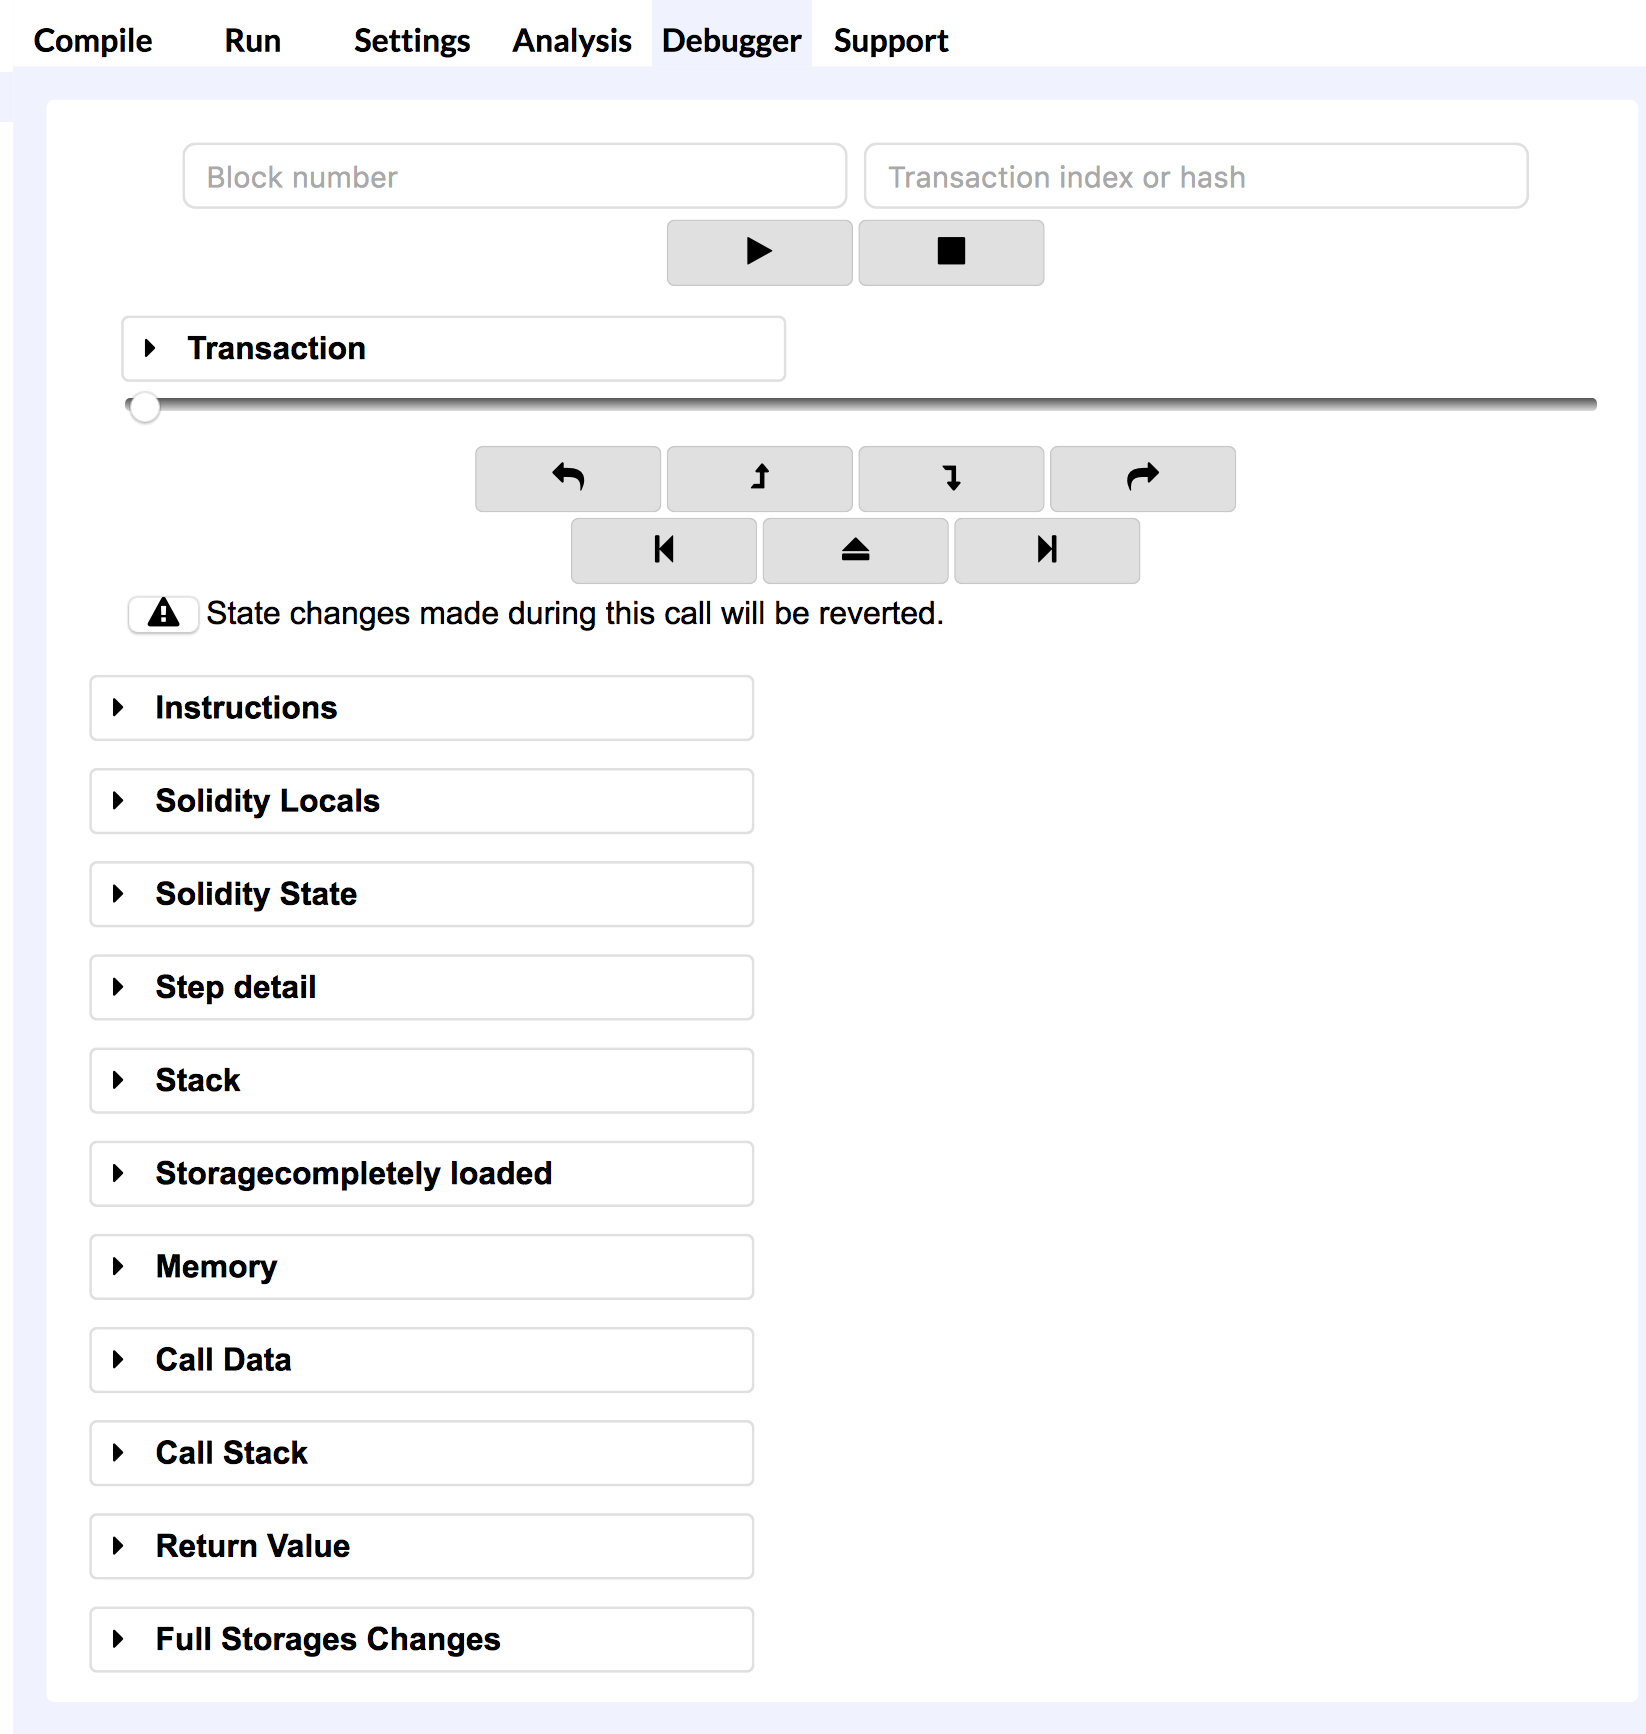
You can see that the debugger stopped inside my constructor. You can use the buttons under the slider to step in, step back, step over, step out, etc. The buttons under that allow you to navigate through your breakpoints.
The transaction slider allows you to quickly maneuver around code as it goes through that specific transaction.
One thing that I like to do when a transaction fails for whatever reason is move the slider to the very end. This will most likely be where your code stopped and could be the cause of the failure.
You'll also notice as you go through the transaction that you'll be able to see the values of state variables and local variables, which will be helpful when you're debugging your code.


